
Economy & Jurisdictions
What the state costs Public finances compared
32 countries compared: government spending, taxes, revenue, debt and budget balances. Why a low tax-to-GDP ratio does not automatically attest to a lean state and sound public finances, nor guarantee individual freedom.
Klaus J. P.-Kilfitt · 1 November 2026 · 8 min read
A low tax-to-GDP ratio is undoubtedly welcome. It would be even more welcome, however, if it also meant that the state could get by on little money. But those are two different things. A state can finance its activities through taxes, natural resources, the profits of public enterprises or — if none of that is enough — debt. Yet a state's expenditure neither shrinks nor disappears simply because it is paid for from other pots — even if, in Germany, for example, the curious coinage “Sondervermögen”, or “special fund”, is apparently intended to suggest precisely that.
Anyone discussing the size of the state soon comes to the government spending-to-GDP ratio. Yet this indicator says little about efficiency. People looking for a new place to call home, by contrast, usually ask about tax rates first. Both approaches are understandable; both fall short.
We have compared the public finances of 32 countries, including the locations in the grenzenlos frei network, the German-speaking countries of origin and twenty Latin American countries. The result is not a ranking of happy and unhappy societies. It is an invitation to take a closer look at public finances.
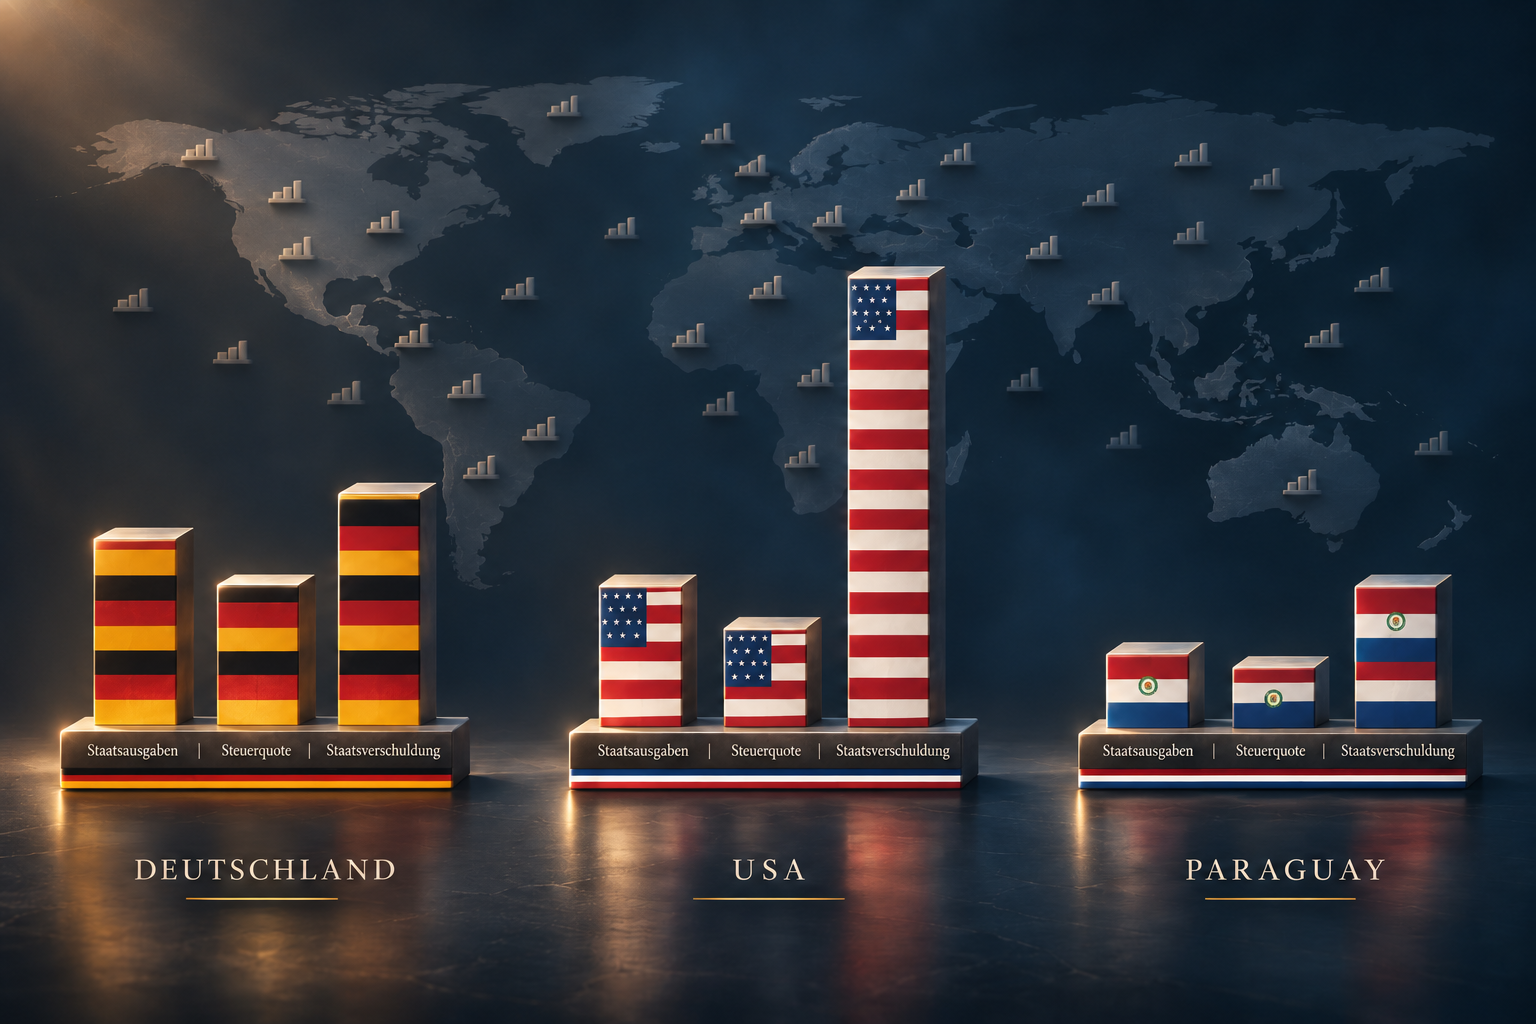
Five figures, five different messages
The government expenditure-to-GDP ratio expresses public spending as a proportion of gross domestic product (GDP). It shows how much the state spends in a year — including, for example, social benefits, administration, infrastructure and debt interest. It shows neither how much the state produces directly nor how wisely it spends its money.
The tax and social contribution-to-GDP ratio measures revenue from taxes and the compulsory social security contributions included in international statistics, again as a proportion of GDP. It is neither an average tax rate for employees nor a calculation of the tax burden on companies and entrepreneurs.
Total government revenue also includes fees, income from assets and certain distributions from state-owned enterprises, among other things. The budget balance shows whether this revenue covers expenditure in the year concerned: a negative figure indicates a deficit, a positive one a surplus. And the government debt-to-GDP ratio records accumulated gross debt relative to annual economic output.
Squeezing these figures into a single index produces a wonderfully sortable ranking, but unfortunately one with no real explanatory value, because afterwards nobody knows what this artificially created hybrid figure actually means. We therefore leave the five measures side by side; readers can decide for themselves which they regard as the most important.
A look across borders: who spends how much?
Austria's government expenditure-to-GDP ratio reaches 55.1 per cent in 2025, Germany's 50.1 per cent. In Switzerland, by contrast, it is just 31.8 per cent. That puts more than 23 percentage points between Austria and Switzerland — even though all three countries are quite comparable in terms of prosperity and economic performance. At 46.9 per cent, Brazil is considerably closer to the European countries Germany and Austria than to Paraguay (19.8 per cent) and Panama (20.9 per cent) on its own continent, the Americas.
There are also some substantial differences among the locations in our network: the International Monetary Fund reports 37.6 per cent for the USA, 24.6 per cent for the Philippines, 21.8 per cent for the United Arab Emirates and 16.2 per cent for Indonesia. Even this selection makes it difficult to speak of the country to emigrate to or the lean state.
And yet we should beware of the obvious conclusion that the lowest bar necessarily marks the most efficient, most capable or even most freedom-minded state. A low expenditure ratio may reflect deliberate restraint. But it may also result from missing public services, weak administration or a different statistical approach. Not every small number is a political achievement.
The interactive comparison: 32 countries, five indicators
Country table: public finances
12 countries · grenzenlos frei network · sorted by Government expenditure 2025 descending
| Country | Expenditure2025 | Tax ratio2024 | Revenue2025 | Balance2025 | Debt2025 |
|---|---|---|---|---|---|
| Cyprus | 40.2 | 36.0 | 43.6 | +3.4 | 55.0 |
| USA | 37.6 | 25.6 | 30.5 | -7.1 | 124.4 |
| Malta | 36.9 | 29.3 | 34.7 | -2.2 | 46.2 |
| Georgia | 28.4 | 25.0 | 27.0 | -1.5 | 34.3 |
| Liechtenstein | 25.3 | 20.1 | 28.1 | +2.8 | 0.5 |
| Methodology for Liechtenstein: The IMF classifies coverage as State Government; 2025 is still an IMF estimate (last actual year: 2024). | |||||
| Philippines | 24.6 | 15.4 | 20.1 | -4.5 | 59.1 |
| Thailand | 22.8 | 16.0 | 21.1 | -1.7 | 64.7 |
| Methodology for Thailand: The 2025 figures refer to the Thai fiscal year (October–September); latest actual figures: FY2024/25. | |||||
| UAE | 21.8 | — | 25.8 | +3.9 | 33.9 |
| Methodology for UAE: No reliable 2024 tax ratio for the UAE is available in the research base used so far. | |||||
| Panama | 20.9 | 11.3 | 17.3 | -3.7 | 56.6 |
| Paraguay | 19.8 | 15.8 | 18.1 | -1.7 | 38.2 |
| Dominican Republic | 19.3 | 14.7 | 15.8 | -3.6 | 59.0 |
| Indonesia | 16.2 | 11.3 | 13.3 | -2.9 | 40.9 |
All values as percentages of GDP. Balance: minus = deficit, plus = surplus. “—” = no reliable value.
Complete data table of all 32 countries (alphabetical)
| Country | Expenditure2025 | Tax ratio2024 | Revenue2025 | Balance2025 | Debt2025 |
|---|---|---|---|---|---|
| Argentina | 31.1 | 27.6 | 31.0 | -0.2 | 80.1 |
| Austria | 55.1 | 43.4 | 50.9 | -4.2 | 81.4 |
| Belize | 25.9 | 24.5 | 24.9 | -1.0 | 66.9 |
| Bolivia | 28.2 | 23.6 | 16.8 | -11.4 | 83.3 |
| Brazil | 46.9 | 33.7 | 39.5 | -7.4 | 93.3 |
| Chile | 26.2 | 20.5 | 23.5 | -2.8 | 41.5 |
| Colombia | 33.2 | 19.9 | 27.4 | -5.8 | 59.9 |
| Costa Rica | 17.8 | 24.8 | 14.4 | -3.4 | 60.4 |
| Cyprus | 40.2 | 36.0 | 43.6 | +3.4 | 55.0 |
| Dominican Republic | 19.3 | 14.7 | 15.8 | -3.6 | 59.0 |
| Ecuador | 38.4 | 21.7 | 35.6 | -2.8 | 54.5 |
| El Salvador | 30.7 | 23.6 | 27.8 | -2.9 | 87.6 |
| Georgia | 28.4 | 25.0 | 27.0 | -1.5 | 34.3 |
| Germany | 50.1 | 38.0 | 47.2 | -2.9 | 62.7 |
| Guatemala | 14.5 | 14.3 | 12.6 | -1.9 | 26.7 |
| Guyana | 23.5 | 9.2 | 18.0 | -5.5 | 28.9 |
| Honduras | 25.0 | 21.1 | 24.2 | -0.7 | 40.3 |
| Indonesia | 16.2 | 11.3 | 13.3 | -2.9 | 40.9 |
| Liechtenstein | 25.3 | 20.1 | 28.1 | +2.8 | 0.5 |
| Malta | 36.9 | 29.3 | 34.7 | -2.2 | 46.2 |
| Mexico | 29.8 | 18.3 | 25.0 | -4.9 | 61.7 |
| Nicaragua | 25.2 | 27.6 | 28.7 | +3.5 | 34.6 |
| Panama | 20.9 | 11.3 | 17.3 | -3.7 | 56.6 |
| Paraguay | 19.8 | 15.8 | 18.1 | -1.7 | 38.2 |
| Peru | 21.4 | 16.3 | 19.0 | -2.4 | 30.1 |
| Philippines | 24.6 | 15.4 | 20.1 | -4.5 | 59.1 |
| Suriname | 37.8 | 19.8 | 29.4 | -8.3 | 96.9 |
| Switzerland | 31.8 | 27.2 | 32.1 | +0.2 | 40.1 |
| Thailand | 22.8 | 16.0 | 21.1 | -1.7 | 64.7 |
| UAE | 21.8 | — | 25.8 | +3.9 | 33.9 |
| Uruguay | 31.5 | 27.3 | 28.1 | -3.4 | 65.6 |
| USA | 37.6 | 25.6 | 30.5 | -7.1 | 124.4 |
The table can be filtered by country group and sorted in ascending or descending order by any of the five indicators. The default view shows the twelve operational locations in the grenzenlos frei network; the full LATAM group examined and the three DACH reference countries can also be selected. The four budget indicators relate to 2025, while the tax and social contribution-to-GDP ratios relate to 2024. All values are percentages of the respective country's GDP.
The state does not live on taxes alone
The comparison becomes particularly revealing when we move from the tax-to-GDP ratio to the total revenue-to-GDP ratio. Panama reports taxes and recorded social contributions of 11.3 per cent of GDP for 2024, Paraguay 15.8 per cent. Yet according to the IMF figures for 2025, the two countries are much closer together in terms of total government revenue: 17.3 per cent in Panama compared with 18.1 per cent in Paraguay.
There is an understandable reason for this. Panama's state budget benefits from its canal, Paraguay's from the binational hydroelectric power plants Itaipú and Yacyretá. In both cases, there are sources of public revenue that cannot simply be equated with income tax or VAT. Since the tax and total revenue ratios used here come from different reporting years and, in some cases, different statistical definitions, the difference cannot simply be presented as an exact figure for “non-tax revenue”. It does, however, show us why looking at taxes alone leaves the picture incomplete.
This particular feature is even more pronounced in the United Arab Emirates (UAE). For 2025, the IMF reports government revenue of 25.8 per cent, but government expenditure of only 21.8 per cent. The federal structure, different sources of revenue and the resulting extreme differences in the revenue of individual emirates make calculating a mean for this comparison seem meaningless, which is why we have omitted a figure from the table.
Debt: the bill from yesterday and tomorrow
Anyone setting expenditure against revenue encounters a deficit in almost every case — sometimes a substantial one. According to the IMF dataset, the USA spent 37.6 per cent of GDP in 2025 but took in only 30.5 per cent. The fiscal balance was minus 7.1 per cent. At the same time, gross government debt reached 124.4 per cent of GDP. A relatively smaller government expenditure share than Germany's simply says nothing about whether current spending is financed.
Brazil also shows a substantial shortfall: expenditure of 46.9 per cent stands against revenue of 39.5 per cent. Conversely, Liechtenstein records a surplus of around 2.8 per cent of GDP, with expenditure of 25.3 per cent and revenue of 28.1 per cent. Reported gross debt there is 0.5 per cent. These figures describe different fiscal starting points; they alone cannot be used to construct a ranking of freedom in society.
Nor does a high debt ratio automatically mean insolvency. The interest burden, currency, creditor structure, maturities, growth and the ability to generate new revenue must also form part of the assessment. Anyone looking at government debt without this context is reading only the last line of a balance sheet without knowing how it came about.
The tax-to-GDP ratio is not your personal tax burden
This distinction has immediate practical significance, particularly for people looking to reorganise where they live or base their business internationally. The economy-wide tax-to-GDP ratio tells us how much a state takes in overall. It does not tell us what proportion of a particular person's income goes to the tax authorities, what taxes a company owes or how different types of income are treated.
A self-employed person, an employed father and an investor can face entirely different burdens in the same country. Then there are tax allowances, social insurance, consumption taxes, the legal structure of the business and — especially important in cross-border cases — actual tax residence and the source of income. In the USA, rules differ considerably between states and municipalities; in Switzerland, between cantons and communes. The nationwide OECD figures already include these levels, but they are no substitute for a comparison of specific locations. Mandatory payments into certain private pension or insurance schemes may also fall outside the statistical tax-to-GDP ratio.
We therefore address what a person or company actually has to pay in a particular location in a separate follow-up article. That article will deal with comparable case scenarios rather than national averages. The statement “Paraguay has a tax-to-GDP ratio of 15.8 per cent” simply cannot be used to infer a personal tax rate of 15.8 per cent. Convenient though that would be.
That leaves a limit which even the most careful statistics cannot overcome: government spending is not a direct measure of the rule of law, freedom of expression, protection of property or the actual freedom to shape one's own life — at most, it offers a pointer. Anyone familiar with our pro-freedom perspective knows that these are precisely the questions that interest us. A government spending-to-GDP ratio may give grounds for criticism, but it does not replace the need to substantiate that criticism.
Freedom cannot be reduced to numbers. Even so, you should know the balance sheet of the state in which you live or work.
Data sources and methodological notes
This study uses the International Monetary Fund's October 2026 World Economic Outlook for expenditure, total revenue, the budget balance and gross government debt in 2025. Not all figures are final annual outturns; depending on the country, some remain estimates. The tax and social contribution-to-GDP ratios come from the available OECD data for 2024 and supplementary official statistics. The five columns must therefore not be read as a single, fully synchronised government budget.
There are also differences in the statistical definition of the government sector. In some countries — such as Guatemala, Costa Rica or Suriname — the underlying IMF series does not cover every level one might expect to fall under “general government”. The table flags these particularities; directly subtracting the tax-to-GDP ratio from total revenue would be especially misleading in these cases.
For reasons of data quality, Cuba, Haiti and Venezuela are not included in the quantitative comparison, although figures are available for some individual indicators. French Guiana, as part of France, is not listed separately; independent Guyana is, of course, included. We list the United Arab Emirates as an operational location — the comparison uses their nationwide figures, not an isolated budget for the emirate of Dubai.
Sources and data status
- International Monetary Fund (IMF): World Economic Outlook — October 2026 database, indicators GGX_NGDP, GGR_NGDP, GGXCNL_NGDP and GGXWDG_NGDP, reporting year 2025.
- OECD/IDB/ECLAC/CIAT: Revenue Statistics in Latin America and the Caribbean 2026 — Tax data for 2024.
- OECD: Revenue Statistics in Asia and the Pacific 2026 — Tax data for 2024.
- OECD: Revenue Statistics 2025 — Tax data for OECD countries for 2024.
- Eurostat: Tax and social contribution-to-GDP ratios for Malta and Cyprus, 2024 — Dataset gov_10a_taxag.
- Liechtenstein Office of Statistics: Taxes and Levies 2025 — Tax and social contribution-to-GDP ratio for 2024.
Data as of: 31 October 2026. All ratios rounded to one decimal place. The underlying working table documents the country coverage and the respective verification status.
More perspectives
Economy & Jurisdictions
Panama wird wählerischer
Seit dem 16. September 2026 gelten in Panama neue Regeln für den Qualified Investor Pass: 300.000 Dollar bleiben nur für neue Immobilien die Schwelle, der Sekundärmarkt erfordert 500.000, und Off-Plan-Investments werden enger gefasst. Warum sich Panama höhere Hürden offenbar leisten kann.
Read articleEconomy & Jurisdictions
Dubai, Panama City or Asunción?
Three cities. Three property markets at entirely different stages of development. But which of them is actually interesting for a European investor?
Read articleEconomy & Jurisdictions
Asunción – The Underrated Metropolis
A city grows upward – and into the future. Evolution Asu 2030! Urbanisation in fast-forward. How Paraguay's capital is currently reinventing itself.
Read article